Edit chart
Loading graph
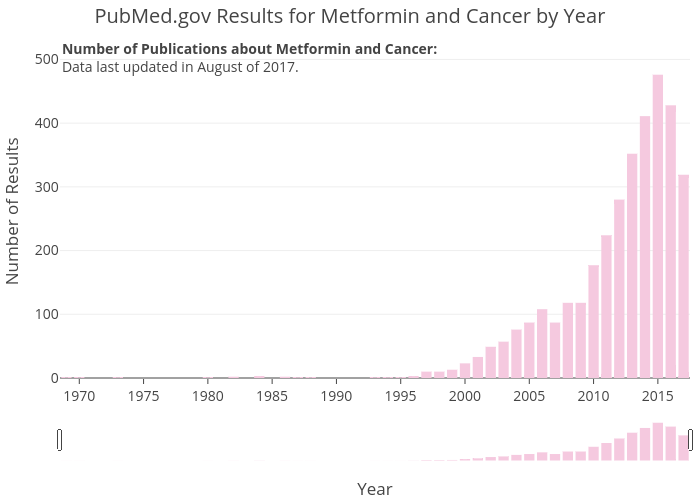
Zwintrob's interactive graph and data of "PubMed.gov Results for Metformin and Cancer by Year" is a bar chart; with Year in the x-axis and Number of Results in the y-axis.. The x-axis shows values from 1968.5 to 2017.5. The y-axis shows values from 0 to 538.9964788732394. This visualization has the following annotation: Number of Publications about Metformin and Cancer:Data last updated in August of 2017.