Edit chart
Loading graph
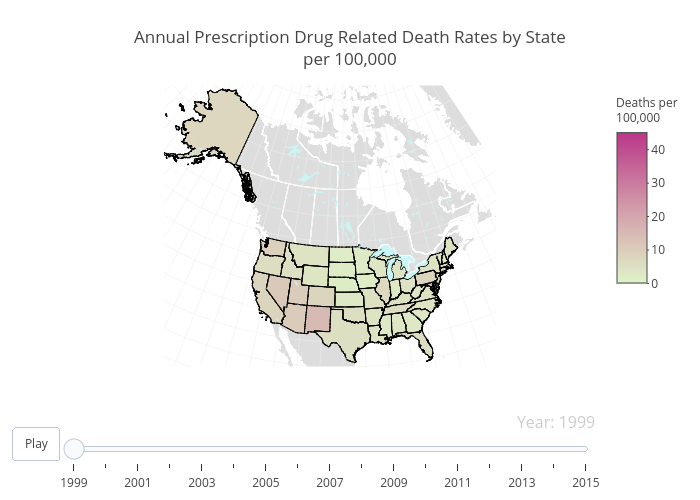
Zwintrob's interactive graph and data of "Annual Prescription Drug Related Death Rates by Stateper 100,000" is a choropleth. The x-axis shows values from 0 to 0. The y-axis shows values from 0 to 0.