Edit chart
Loading graph
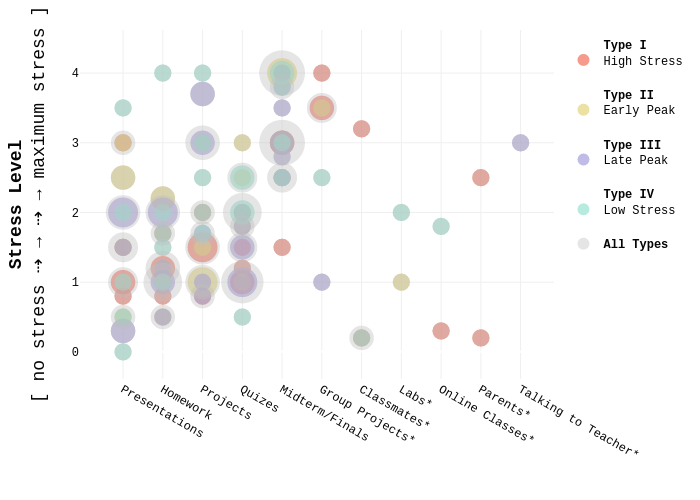
Yvetteshen's interactive graph and data of "" is a scatter chart, showing Type IHigh Stress, Type IIEarly Peak, Type IIILate Peak, Type IVLow Stress, All Types; with Stress Level[ no stress ⇢ → ⇢ → maximum stress ] in the y-axis. The x-axis shows values from -0.8816896276101523 to 10.7311662097388. The y-axis shows values from -0.4302356524959229 to 4.714914648946643.