Edit chart
Loading graph
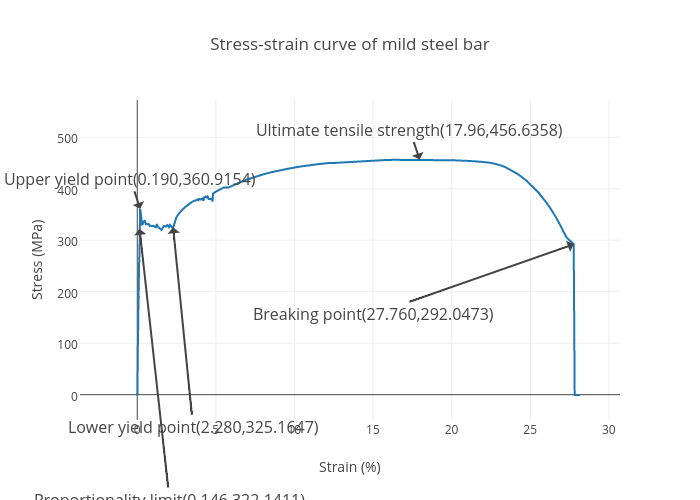
Yuyin811's interactive graph and data of "Stress-strain curve of mild steel bar" is a scatter chart, showing Col1; with Strain (%) in the x-axis and Stress (MPa) in the y-axis.. The x-axis shows values from -3.6417557338460376 to 30.70408982561793. The y-axis shows values from -49.157567843612625 to 572.2785882234425. This visualization has the following annotations: Upper yield point(0.190,360.9154); Proportionality limit(0.146,322.1411); Lower yield point(2.280,325.1647); Ultimate tensile strength(17.96,456.6358); Breaking point(27.760,292.0473)