Edit chart
Loading graph
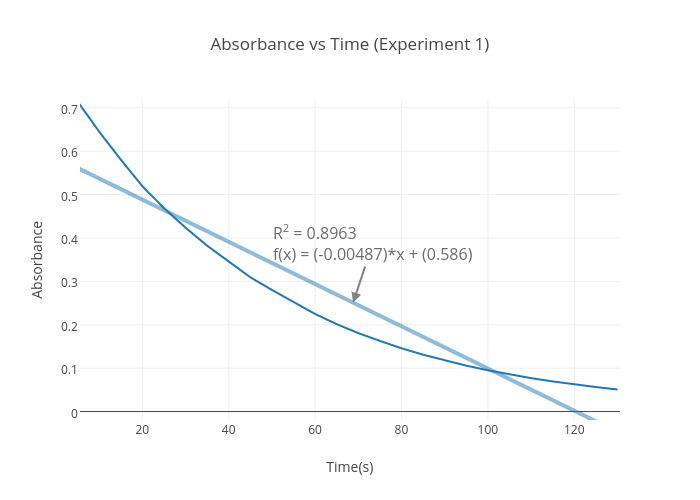
Yunqiiu's interactive graph and data of "Absorbance vs Time (Experiment 1)" is a scatter chart, showing Absorbance vs Absorbance - fit; with Time(s) in the x-axis and Absorbance in the y-axis.. The x-axis shows values from 5.560513311797919 to 130.5605133117979. The y-axis shows values from -0.019511399952453823 to 0.7178863778253238. This visualization has the following annotation: R2 = 0.8963f(x) = (-0.00487)*x + (0.586)