Edit chart
Loading graph
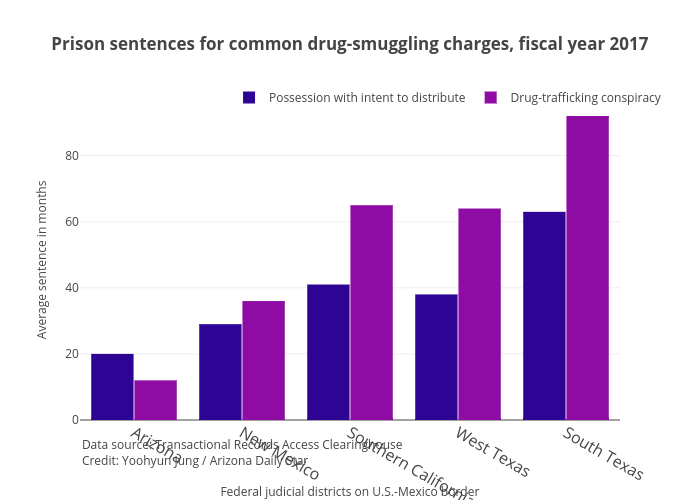
Yjungnews's interactive graph and data of "Prison sentences for common drug-smuggling charges, fiscal year 2017" is a grouped bar chart, showing Possession with intent to distribute vs Drug-trafficking conspiracy; with Federal judicial districts on U.S.-Mexico border in the x-axis and Average sentence in months in the y-axis.. The x-axis shows values from -0.5 to 4.5. The y-axis shows values from 0 to 96.84210526315789. This visualization has the following annotation: Data source: Transactional Records Access ClearinghouseCredit: Yoohyun Jung / Arizona Daily Star