Edit chart
Loading graph
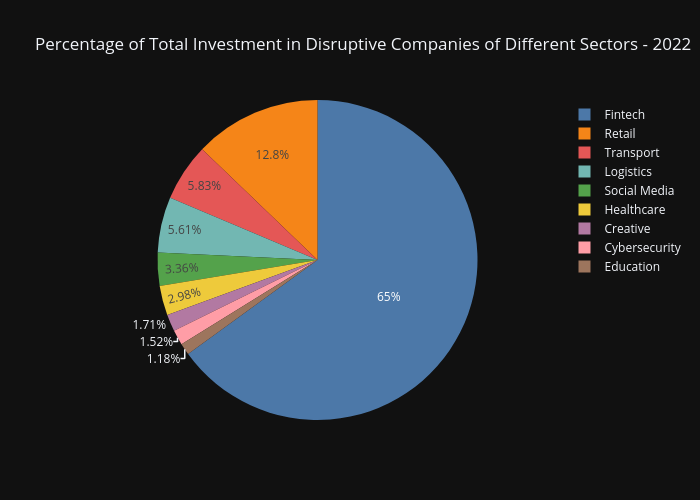
Xcelplex's interactive graph and data of "Percentage of Total Investment in Disruptive Companies of Different Sectors - 2022" is a pie. The x-axis shows values from -1 to 6. The y-axis shows values from -1 to 4.