Edit chart
Loading graph
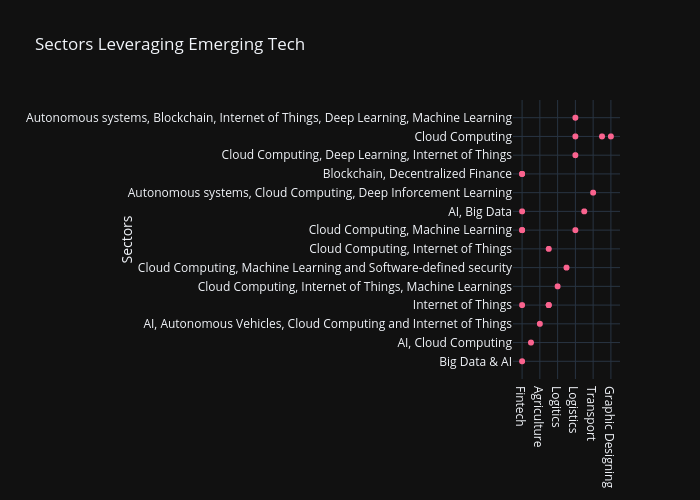
Xcelplex's interactive graph and data of "Sectors Leveraging Emerging Tech" is a scatter chart; with Sectors in the y-axis. The x-axis shows values from -0.7983682983682983 to 10.798368298368299. The y-axis shows values from -1.3717026378896884 to 14.371702637889689.