0
5
10
15
20
25
30
0
200
400
600
800
1000
d = 2mm
d = 4mm
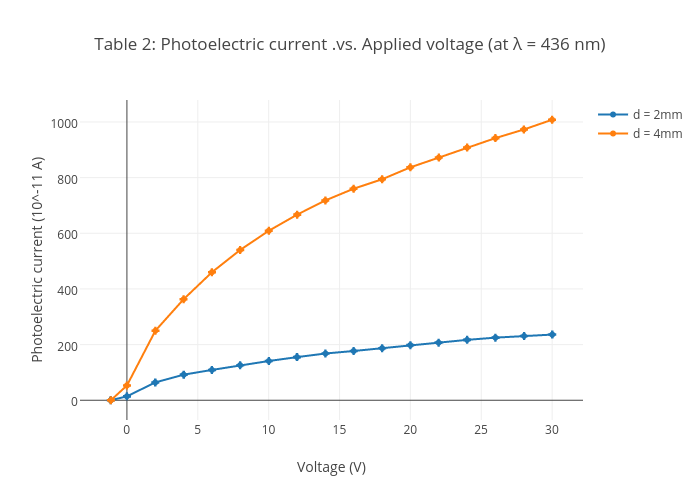
Table 2: Photoelectric current .vs. Applied voltage (at λ = 436 nm)
Voltage (V)
Photoelectric current (10^-11 A)
plotly-logomark
Edit chart
Xavierdosson's interactive graph and data of "Table 2: Photoelectric current .vs. Applied voltage (at λ = 436 nm)" is a line chart, showing d = 2mm vs d = 4mm; with Voltage (V) in the x-axis and Photoelectric current (10^-11 A) in the y-axis.. The x-axis shows values from -3.0398858447488584 to 31.90988584474886. The y-axis shows values from -67.2540192926045 to 1075.2540192926044.