Edit chart
Loading graph
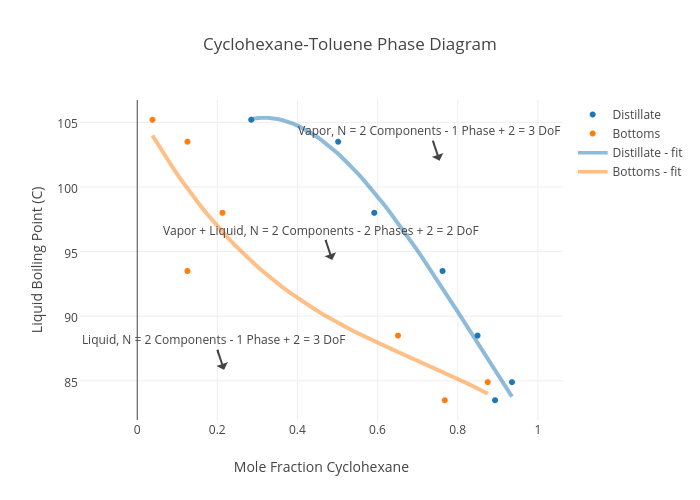
Wrighb4's interactive graph and data of "Cyclohexane-Toluene Phase Diagram" is a scatter chart, showing Distillate , Bottoms, Distillate - fit, Bottoms - fit; with Mole Fraction Cyclohexane in the x-axis and Liquid Boiling Point (C) in the y-axis.. The x-axis shows values from -0.016686672029890534 to 0.9899261086398905. The y-axis shows values from 82.01356011183597 to 106.68643988816403. This visualization has the following annotations: Vapor + Liquid, N = 2 Components - 2 Phases + 2 = 2 DoF ; Vapor, N = 2 Components - 1 Phase + 2 = 3 DoF; Liquid, N = 2 Components - 1 Phase + 2 = 3 DoF