Edit chart
Loading graph
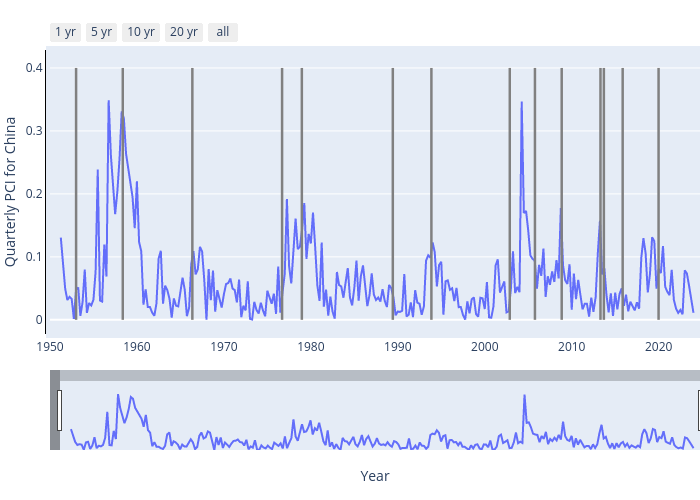
Weifeng.zhong's interactive graph and data of "Quarterly PCI for China vs Year" is a scatter chart; with Year in the x-axis and Quarterly PCI for China in the y-axis.. The x-axis shows values from 1950-01-01 to 2024-10-01. The y-axis shows values from 0 to 0.