Edit chart
Loading graph
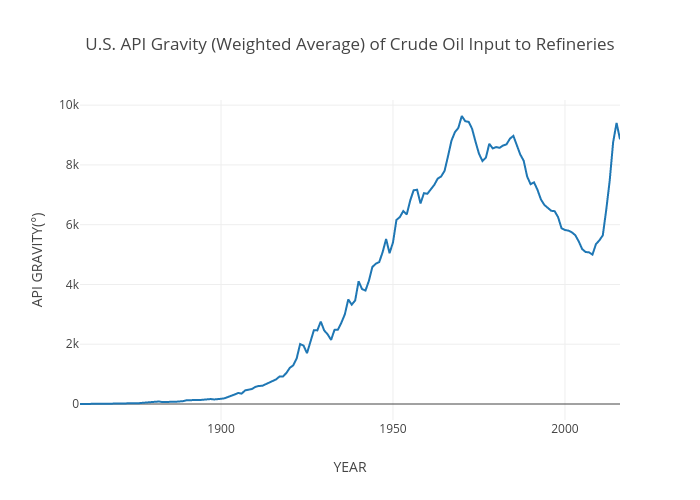
Weekhoo's interactive graph and data of "U.S. API Gravity (Weighted Average) of Crude Oil Input to Refineries" is a line chart, showing API; with YEAR in the x-axis and API GRAVITY(°) in the y-axis.. The x-axis shows values from 0 to 0. The y-axis shows values from 0 to 0.