Edit chart
Loading graph
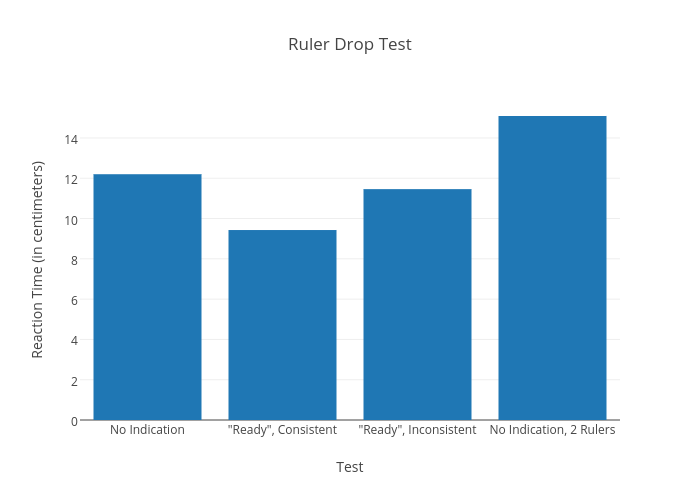
Wbobo24's interactive graph and data of "Ruler Drop Test" is a bar chart, showing Col2; with Test in the x-axis and Reaction Time (in centimeters) in the y-axis.. The x-axis shows values from -0.5 to 3.5. The y-axis shows values from 0 to 15.884210526315789.