Edit chart
Loading graph
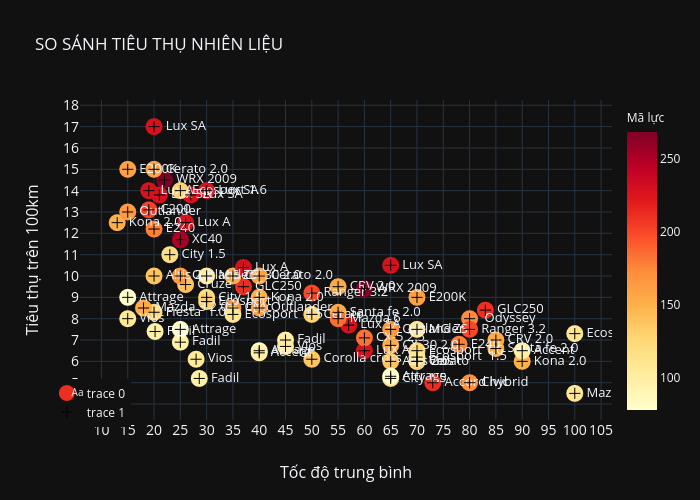
Unsis's interactive graph and data of "SO SÁNH TIÊU THỤ NHIÊN LIỆU" is a ; with Tốc độ trung bình in the x-axis and Tiêu thụ trên 100km in the y-axis.. The x-axis shows values from 7.117176723036836 to 105.88282327696317. The y-axis shows values from 3.9173395977095873 to 18.08266040229041.