Edit chart
Loading graph
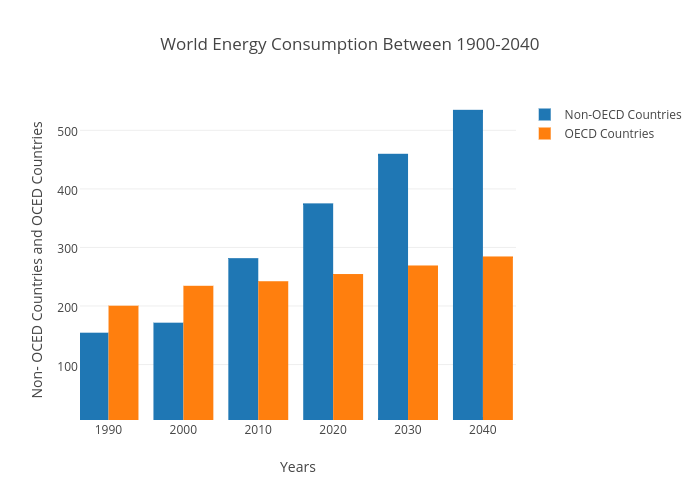
Ttam1's interactive graph and data of "World Energy Consumption Between 1900-2040" is a bar chart, showing Non-OECD Countries vs OECD Countries; with Years in the x-axis and Non- OCED Countries and OCED Countries in the y-axis.. The x-axis shows values from 1986.191184174153 to 2044.4179161870634. The y-axis shows values from 5.252470281976599 to 551.8686860733521.