0
10
20
30
40
50
60
70
1.6
1.7
1.8
1.9
2
2.1
2.2
2.3
2.4
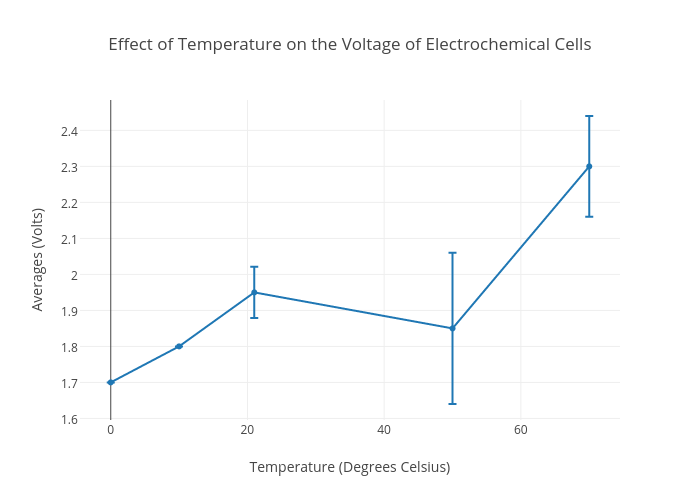
Effect of Temperature on the Voltage of Electrochemical Cells
Temperature (Degrees Celsius)
Averages (Volts)
plotly-logomark
Edit chart
Towleh1's interactive graph and data of "Effect of Temperature on the Voltage of Electrochemical Cells" is a scatter chart, showing Averages (Volts) ; with Temperature (Degrees Celsius) in the x-axis and Averages (Volts) in the y-axis.. The x-axis shows values from -4.229064613949149 to 74.22906461394915. The y-axis shows values from 1.5955555555555556 to 2.4844444444444442.