Edit chart
Loading graph
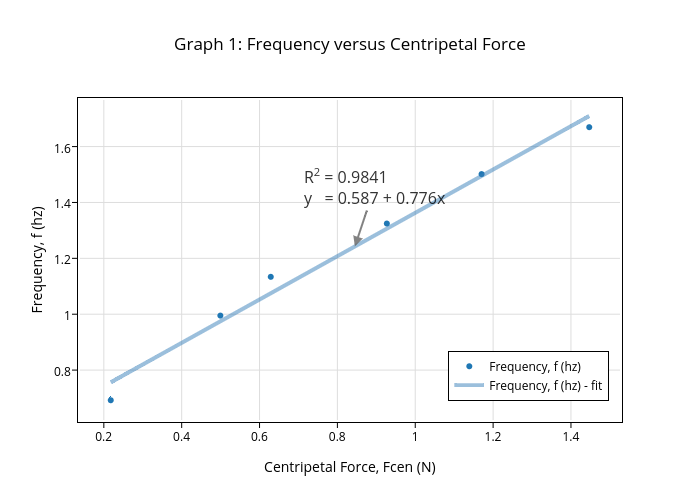
Tonyzou's interactive graph and data of "Graph 1: Frequency versus Centripetal Force" is a scatter chart, showing Frequency, f (hz) vs Frequency, f (hz) - fit; with Centripetal Force, Fcen (N) in the x-axis and Frequency, f (hz) in the y-axis.. The x-axis shows values from 0.14586980671265587 to 1.518887193287344. The y-axis shows values from 0.6302438415835672 to 1.7662551188074793. This visualization has the following annotation: R2 = 0.9841y = 0.587 + 0.776x