Edit chart
Loading graph
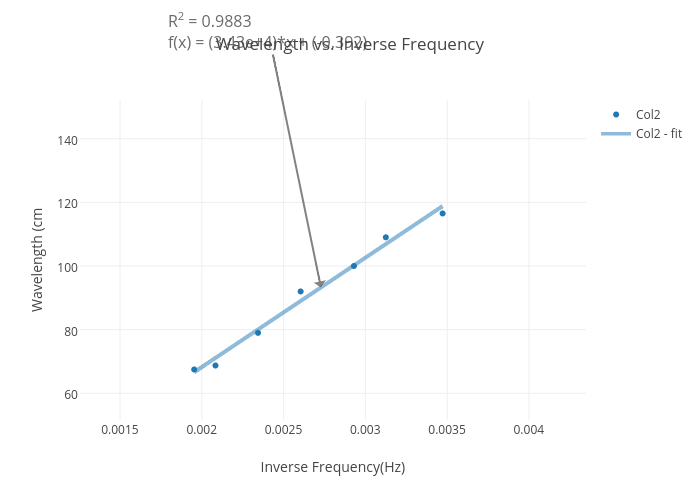
Tonyly95's interactive graph and data of "Wavelength vs. Inverse Frequency" is a scatter chart, showing Col2 vs Col2 - fit; with Inverse Frequency(Hz) in the x-axis and Wavelength (cm in the y-axis.. The x-axis shows values from 0.0012549985288989342 to 0.00434889053860308. The y-axis shows values from 51.63390262823222 to 152.124510535661. This visualization has the following annotation: R2 = 0.9883f(x) = (3.43e+4)*x + (-0.392)