Edit chart
Loading graph
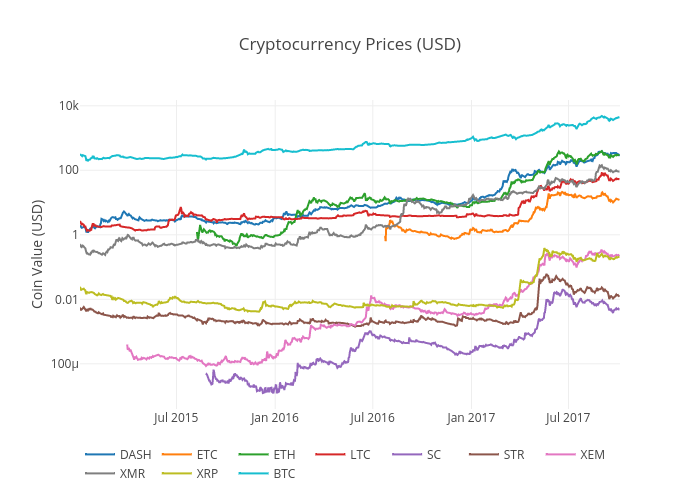
Tomymacmillan's interactive graph and data of "Cryptocurrency Prices (USD)" is a scatter chart, showing DASH, ETC, ETH, LTC, SC, STR, XEM, XMR, XRP, BTC; with time in the x-axis and Coin Value (USD) in the y-axis.. The x-axis shows values from 0 to 0. The y-axis shows values from 0 to 0.