Edit chart
Loading graph
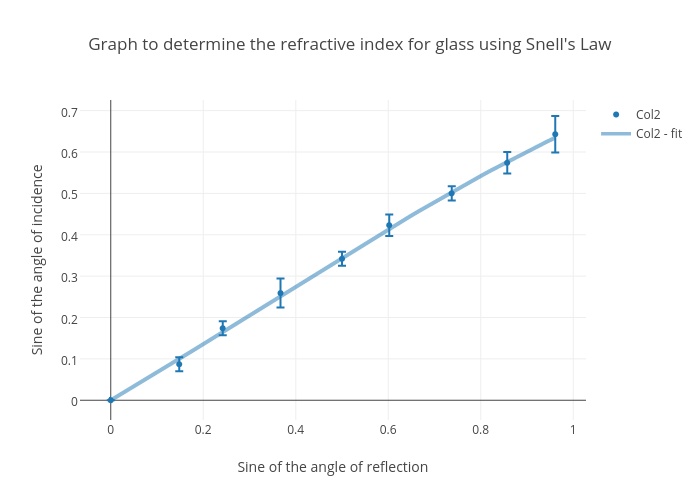
Timtjtim's interactive graph and data of "Graph to determine the refractive index for glass using Snell's Law" is a scatter chart, showing Col2 vs Col2 - fit; with Sine of the angle of reflection in the x-axis and Sine of the angle of incidence in the y-axis.. The x-axis shows values from -0.056618315993225254 to 1.0176183159932253. The y-axis shows values from -0.04310514846090983 to 0.7254265867611006.