Edit chart
Loading graph
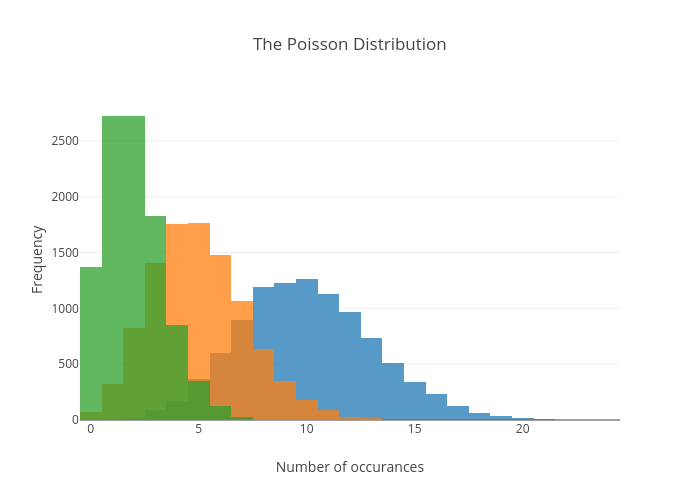
Timless's interactive graph and data of "The Poisson Distribution" is a histogram, showing expected=10, expected=5, expected=2; with Number of occurances in the x-axis and Frequency in the y-axis.. The x-axis shows values from 0 to 0. The y-axis shows values from 0 to 0.