Edit chart
Loading graph
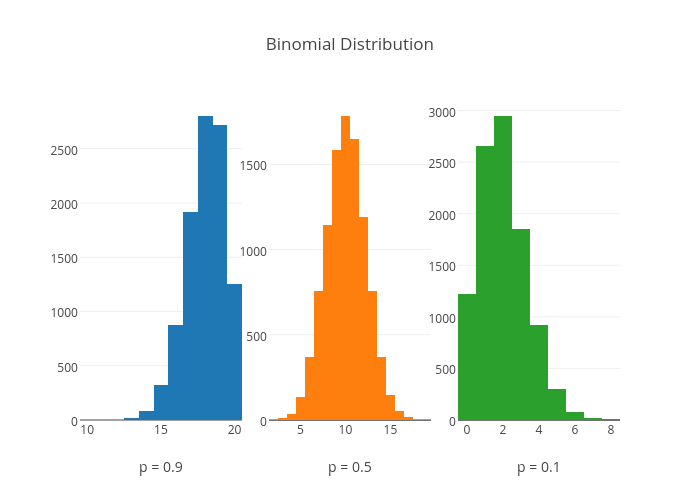
Timless's interactive graph and data of "Binomial Distribution" is a histogram; with p = 0.9 in the x-axis. The x-axis shows values from 0 to 0. The y-axis shows values from 0 to 0.