Edit chart
Loading graph
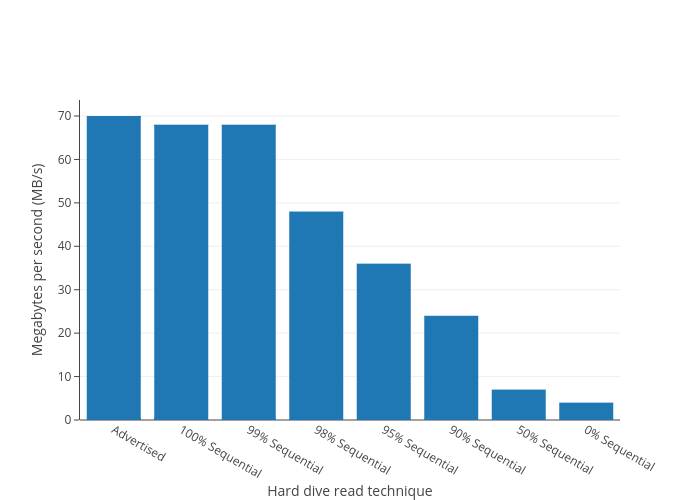
Thomaslaurenson's interactive graph and data of "Megabytes per second (MB/s) vs Hard dive read technique" is a bar chart, showing Col2; with Hard dive read technique in the x-axis and Megabytes per second (MB/s) in the y-axis.. The x-axis shows values from -0.5 to 7.5. The y-axis shows values from 0 to 73.6842105263158.