Edit chart
Loading graph
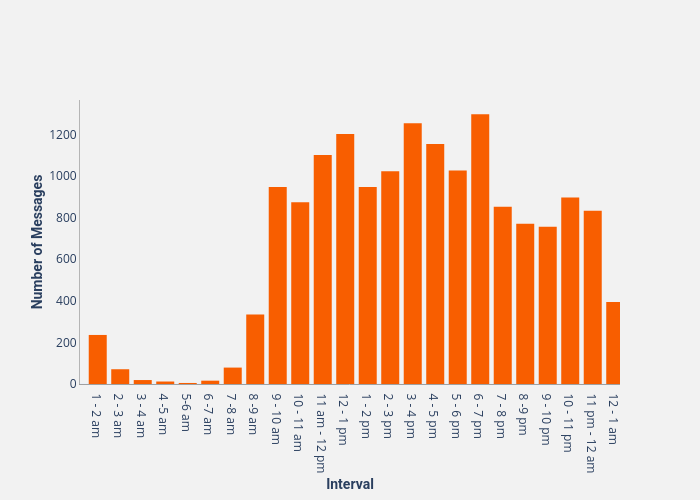
Thedivtagguy's interactive graph and data of "Number of Messages vs Interval" is a bar chart; with Interval in the x-axis and Number of Messages in the y-axis.. The x-axis shows values from -0.7885245901639344 to 23.211475409836066. The y-axis shows values from 0 to 1366.3157894736842.