Edit chart
Loading graph
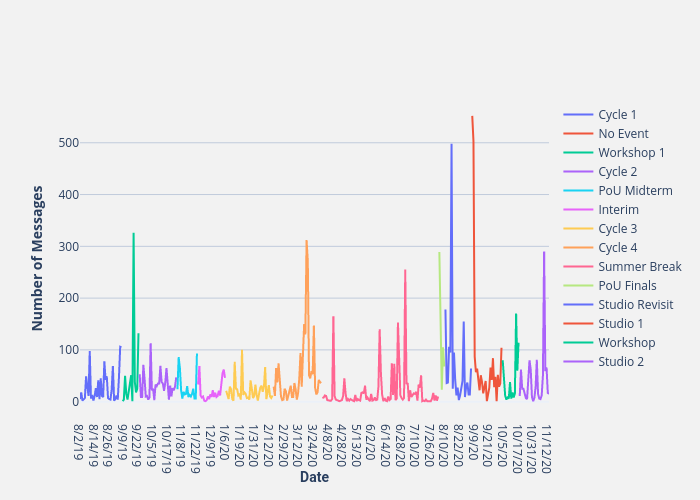
Thedivtagguy's interactive graph and data of "Number of Messages vs Date" is a line chart; with Date in the x-axis and Number of Messages in the y-axis.. The x-axis shows values from 0 to 385. The y-axis shows values from -29.611111111111114 to 582.6111111111111.