Edit chart
Loading graph
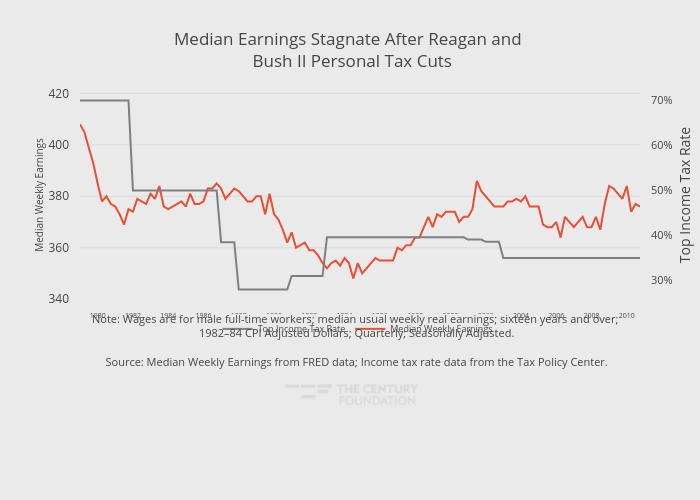
Thecenturyfoundation's interactive graph and data of "Median Earnings Stagnate After Reagan and Bush II Personal Tax Cuts" is a line chart, showing Median Weekly Earnings vs Top Income Tax Rate; with in the x-axis and Median Weekly Earnings in the y-axis.. The x-axis shows values from 1979-01-01 to 2010-10-01. The y-axis shows values from 339.6666666666667 to 421.3333333333333. This visualization has the following annotation: Note: Wages are for male full-time workers; median usual weekly real earnings; sixteen years and over; <br>1982–84 CPI Adjusted Dollars; Quarterly; Seasonally Adjusted.Source: Median Weekly Earnings from FRED data; Income tax rate data from the Tax Policy Center.