Edit chart
Loading graph
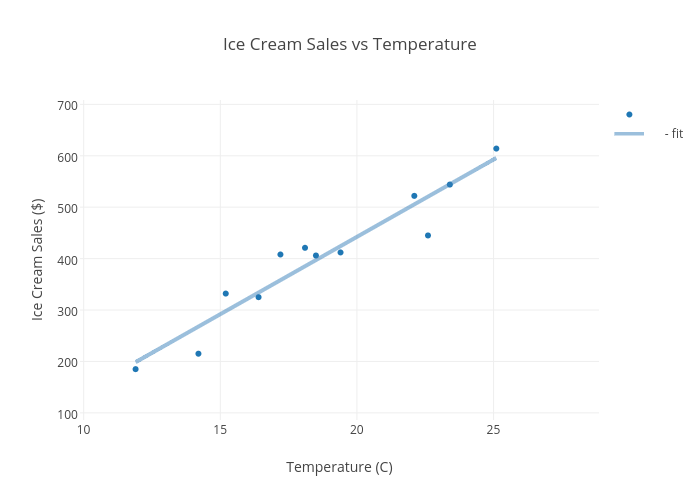
Thapan18's interactive graph and data of "Ice Cream Sales vs Temperature" is a scatter chart, showing vs - fit; with Temperature (C) in the x-axis and Ice Cream Sales ($) in the y-axis.. The x-axis shows values from 9.866168241187175 to 28.857799985684938. The y-axis shows values from 86.06858529692443 to 708.4681581551251.