Edit chart
Loading graph
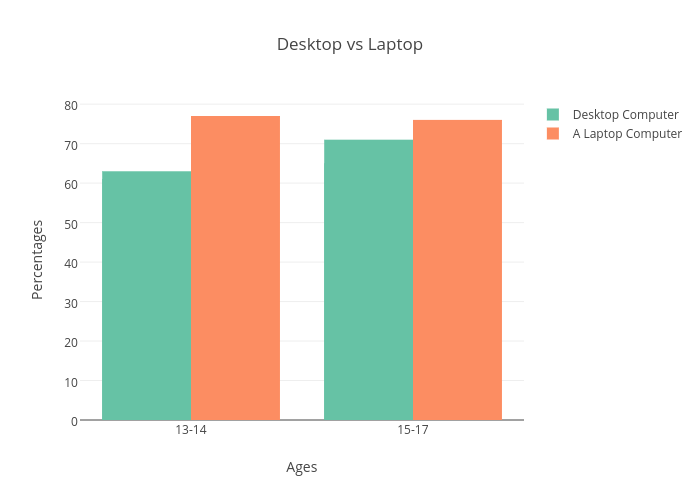
Taywhite's interactive graph and data of "Desktop vs Laptop" is a bar chart, showing Desktop Computer vs A Laptop Computer; with Ages in the x-axis and Percentages in the y-axis.. The x-axis shows values from -0.5 to 1.5. The y-axis shows values from 0 to 81.05263157894737.