Edit chart
Loading graph
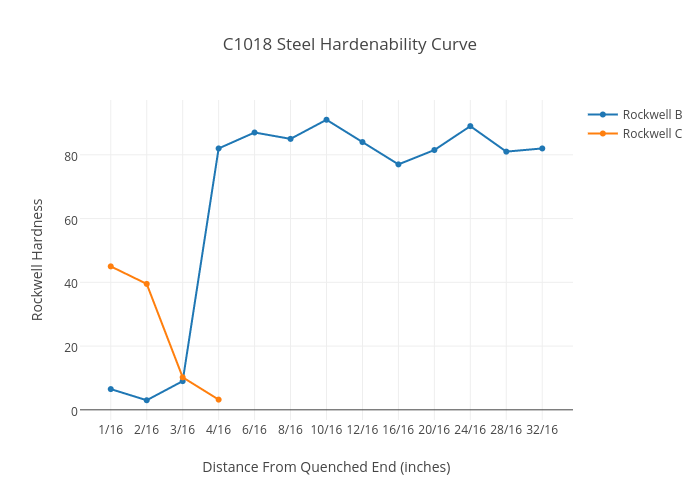
Taijuonfire's interactive graph and data of "C1018 Steel Hardenability Curve" is a scatter chart, showing Rockwell B vs Rockwell C; with Distance From Quenched End (inches) in the x-axis and Rockwell Hardness in the y-axis.. The x-axis shows values from -0.78381691867593 to 12.78381691867593. The y-axis shows values from -3.171388597411683 to 97.17138859741168.