Edit chart
Loading graph
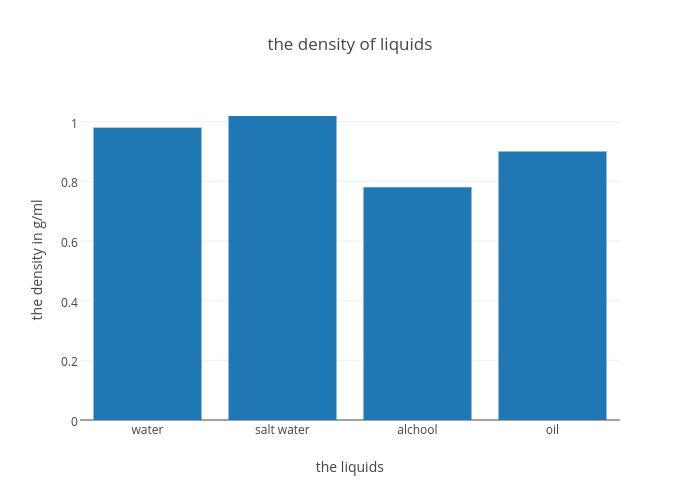
Sydneyobrien12's interactive graph and data of "the density of liquids" is a bar chart, showing Col2; with the liquids in the x-axis and the density in g/ml in the y-axis.. The x-axis shows values from -0.5 to 3.5. The y-axis shows values from 0 to 1.0726315789473684.