Edit chart
Loading graph
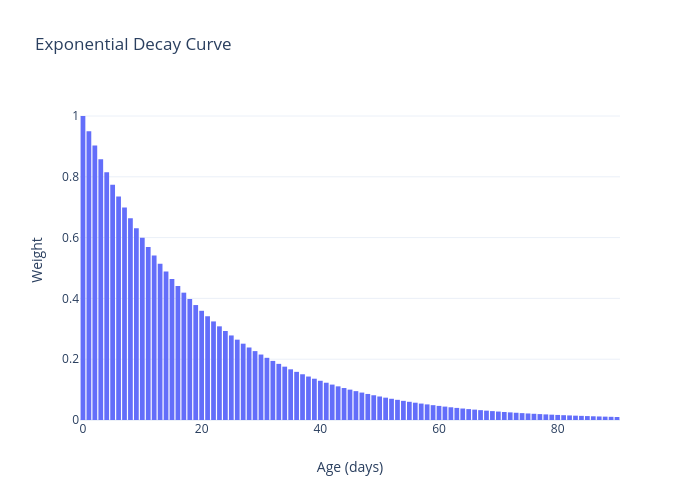
Sushantt's interactive graph and data of "Exponential Decay Curve" is a bar chart; with Age (days) in the x-axis and Weight in the y-axis.. The x-axis shows values from -0.5 to 90.5. The y-axis shows values from 0 to 1.0526315789473684.