Edit chart
Loading graph
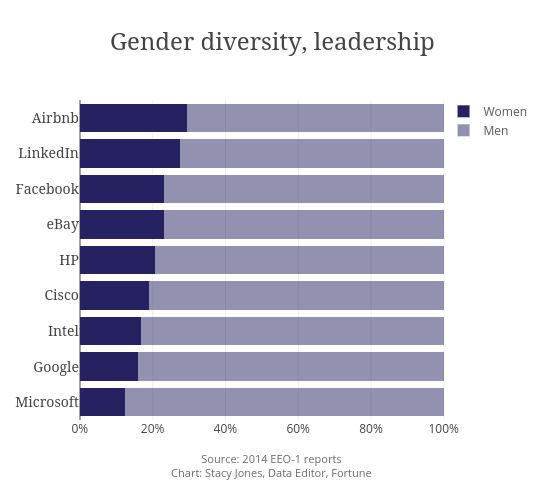
Stacyannj's interactive graph and data of "Gender diversity, leadership" is a stacked bar chart, showing Women vs Men; with Source: 2014 EEO-1 reportsChart: Stacy Jones, Data Editor, Fortune in the x-axis. The x-axis shows values from 0 to 105.26315789473685. The y-axis shows values from 8.5 to -0.5.