Edit chart
Loading graph
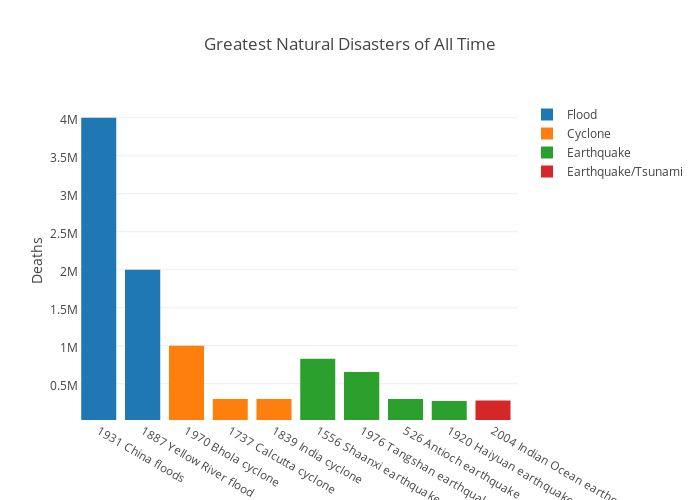
Srhagema's interactive graph and data of "Greatest Natural Disasters of All Time" is a grouped bar chart, showing Flood, Cyclone, Earthquake, Earthquake/Tsunami; with Deaths in the y-axis. The x-axis shows values from -0.43023793689811995 to 9.569762063101878. The y-axis shows values from 22829.929949921323 to 4233356.245739392.