Edit chart
Loading graph
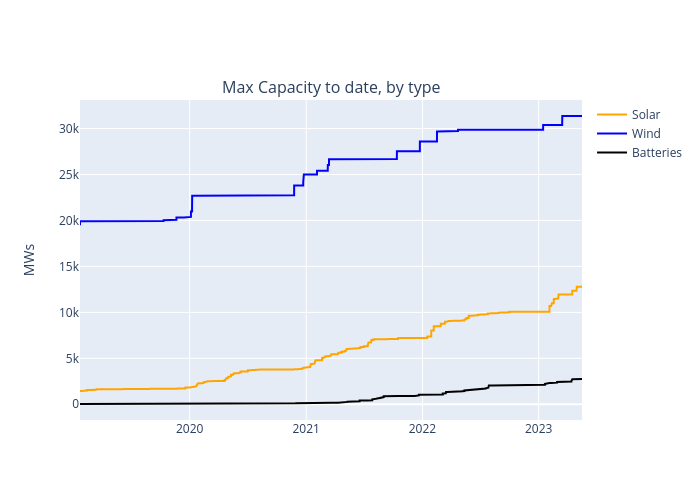
Sreedy640's interactive graph and data of "Solar, Wind, Batteries" is a line chart, showing Solar, Wind, Batteries; with MWs in the y-axis. The x-axis shows values from 0 to 0. The y-axis shows values from 0 to 0. This visualization has the following annotation: Max Capacity to date, by type