Edit chart
Loading graph
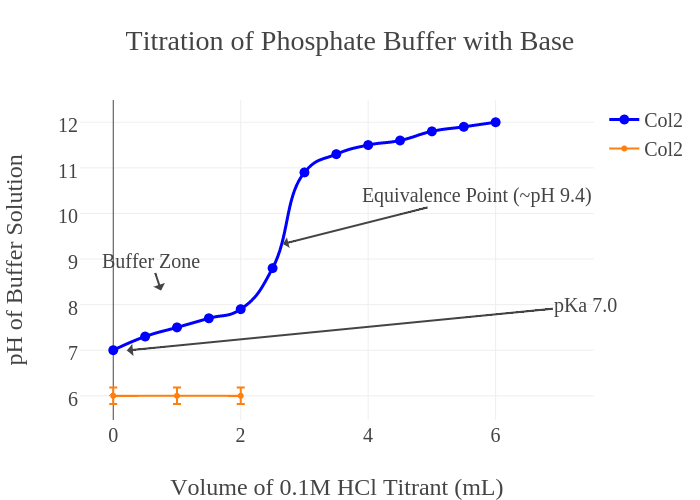
Sprrusso's interactive graph and data of "Titration of Phosphate Buffer with Base" is a scatter chart, showing Col2 vs Col2; with Volume of 0.1M HCl Titrant (mL) in the x-axis and pH of Buffer Solution in the y-axis.. The x-axis shows values from -0.37813121272365807 to 6.378131212723658. The y-axis shows values from 6.6605047991468185 to 12.339495200853182. This visualization has the following annotations: Equivalence Point (~pH 9.4); Buffer Zone; pKa 7.0