Edit chart
Loading graph
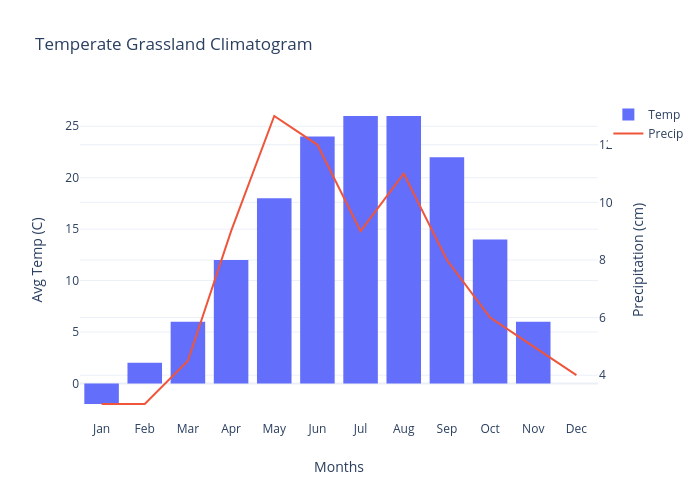
Speckd19's interactive graph and data of "Temperate Grassland Climatogram" is a bar chart, showing Temp vs Precip; with Months in the x-axis and Avg Temp (C) in the y-axis.. The x-axis shows values from -0.5 to 11.5. The y-axis shows values from -3.555555555555556 to 27.555555555555557.