Edit chart
Loading graph
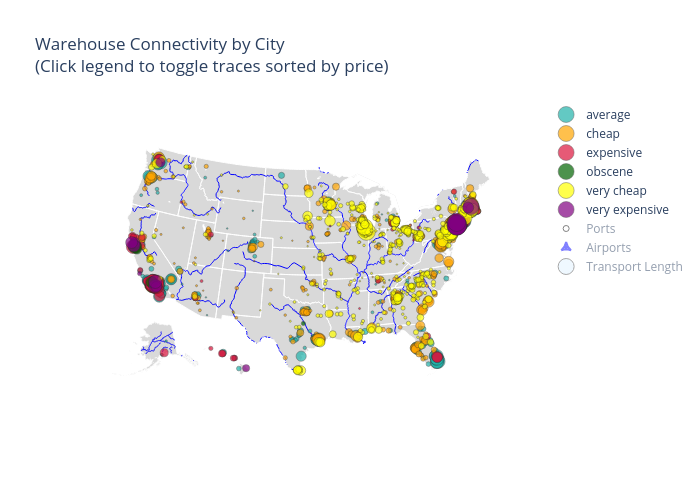
Snuzbrokh's interactive graph and data of "Warehouse Connectivity by City (Click legend to toggle traces sorted by price)" is a scattergeo, showing average, cheap, expensive, obscene, very cheap, very expensive, Ports, Airports, Transport Length. The x-axis shows values from 0 to 0. The y-axis shows values from 0 to 0.