Edit chart
Loading graph
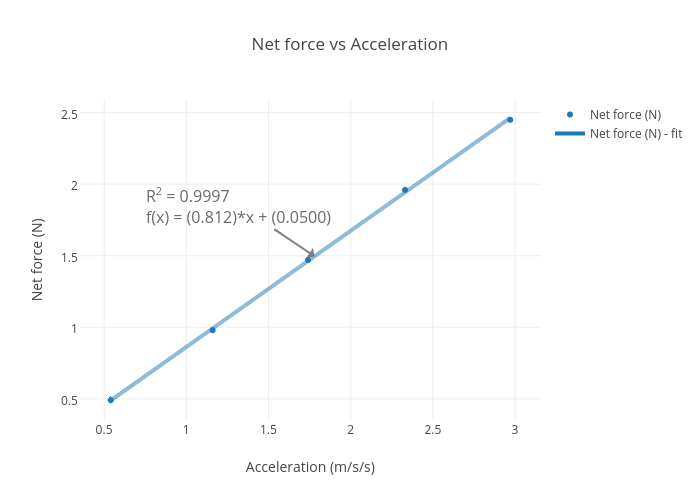
Smihulet2's interactive graph and data of "Net force vs Acceleration" is a scatter chart, showing Net force (N) vs Net force (N) - fit; with Acceleration (m/s/s) in the x-axis and Net force (N) in the y-axis.. The x-axis shows values from 0.38678629249865093 to 3.1232137075013493. The y-axis shows values from 0.349676674364896 to 2.5903233256351044. This visualization has the following annotation: R2 = 0.9997f(x) = (0.812)*x + (0.0500)