Edit chart
Loading graph
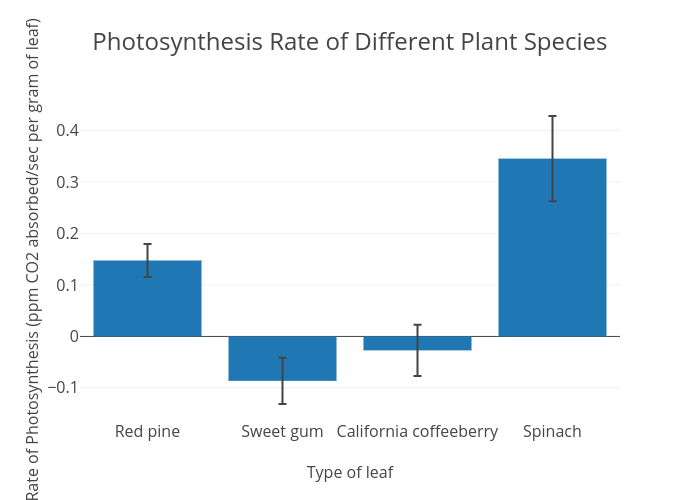
Sk17921's interactive graph and data of "Photosynthesis Rate of Different Plant Species" is a bar chart, showing Col2; with Type of leaf in the x-axis and Rate of Photosynthesis (ppm CO2 absorbed/sec per gram of leaf) in the y-axis.. The x-axis shows values from -0.5 to 3.5. The y-axis shows values from -0.16239444444444445 to 0.4594944444444444.