Edit chart
Loading graph
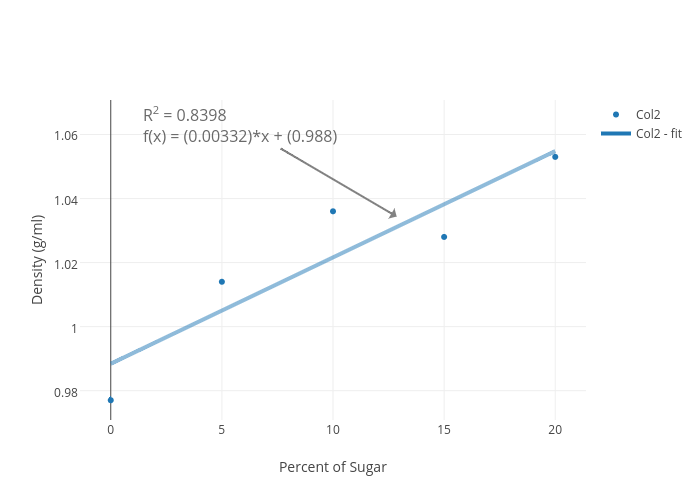
Siebek2999's interactive graph and data of "Density (g/ml) vs Percent of Sugar" is a scatter chart, showing Col2 vs Col2 - fit; with Percent of Sugar in the x-axis and Density (g/ml) in the y-axis.. The x-axis shows values from -1.2127867252318207 to 21.212786725231823. The y-axis shows values from 0.9712180947957574 to 1.0663044031309323. This visualization has the following annotation: R2 = 0.8398f(x) = (0.00332)*x + (0.988)