Edit chart
Loading graph
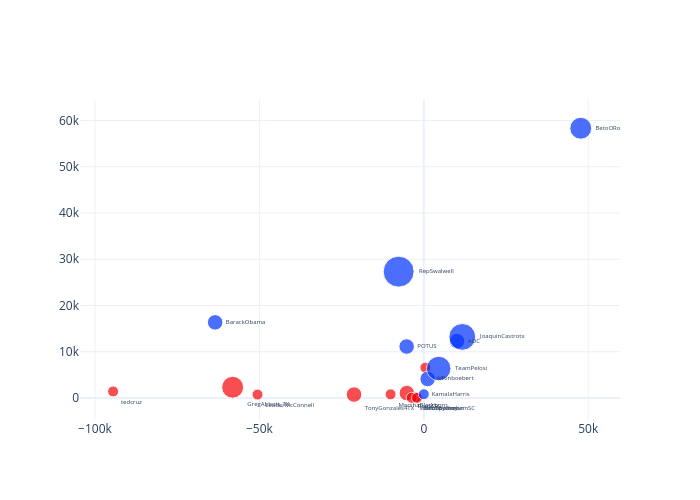
Sheyril's interactive graph and data is a . The x-axis shows values from -103791.17624136104 to 58241.70825776576. The y-axis shows values from -5224.90259705676 to 65300.53339453398.