0.5
1
1.5
2
2.5
3
3.5
500
1000
1500
2000
2500
Col2
Col2 - fit
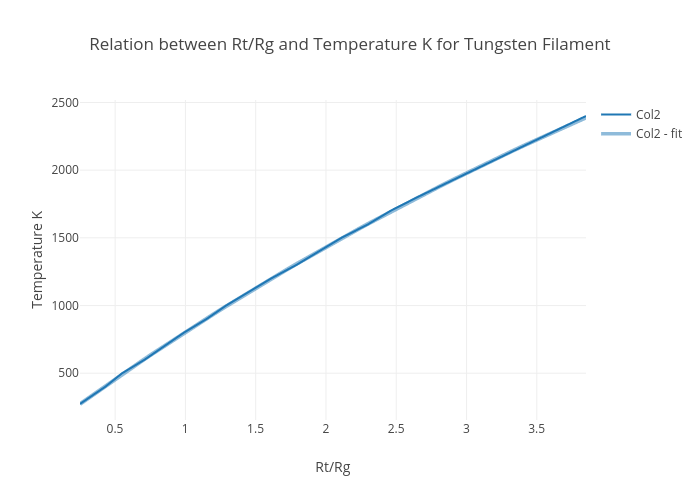
Relation between Rt/Rg and Temperature K for Tungsten Filament
Rt/Rg
Temperature K
plotly-logomark
Edit chart
Sharlom's interactive graph and data of "Relation between Rt/Rg and Temperature K for Tungsten Filament" is a scatter chart, showing Col2 vs Col2 - fit; with Rt/Rg in the x-axis and Temperature K in the y-axis.. The x-axis shows values from 0.25 to 3.85. The y-axis shows values from 154.21263246296098 to 2518.199335133528.