Edit chart
Loading graph
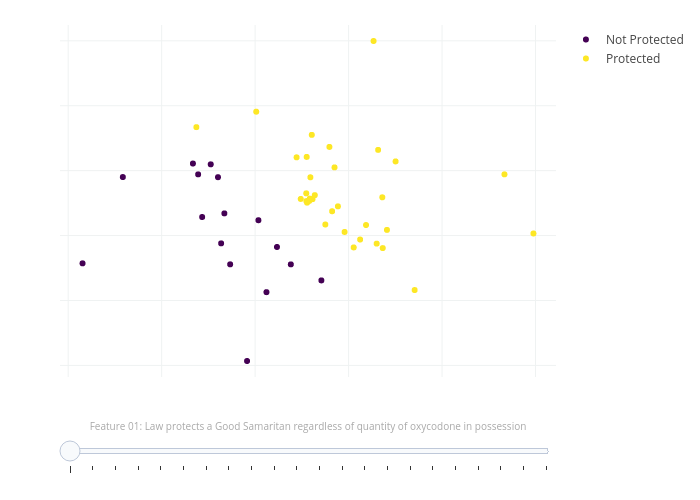
Shanereader's interactive graph and data of "Not Protected vs Protected" is a scatter chart, showing Not Protected vs Protected. The x-axis shows values from -3.08771582888904 to 2.21923545539964. The y-axis shows values from 4.82163768322616 to 10.2433206566034.