Edit chart
Loading graph
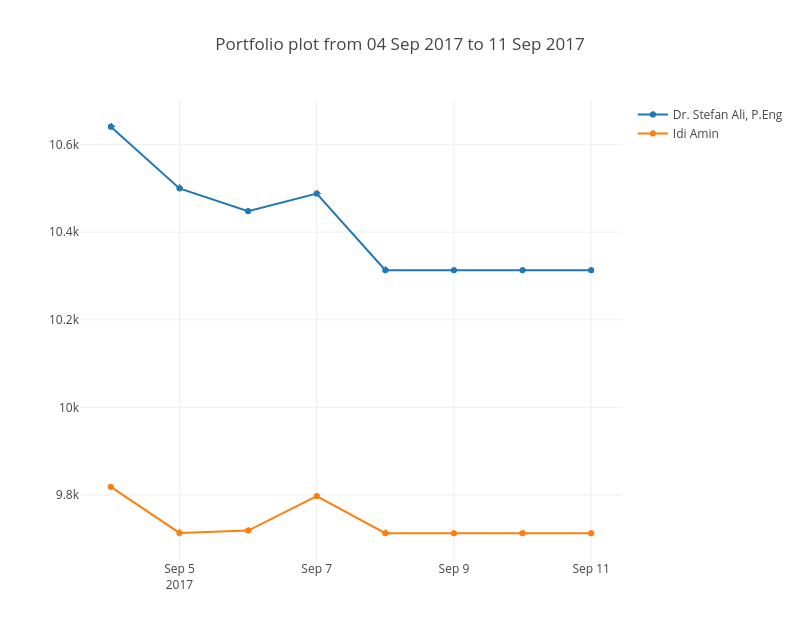
Shaileshahuja2's interactive graph and data of "Portfolio plot from 04 Sep 2017 to 11 Sep 2017" is a scatter chart, showing Dr. Stefan Ali, P.Eng vs Idi Amin. The x-axis shows values from 0 to 0. The y-axis shows values from 0 to 0.