Edit chart
Loading graph
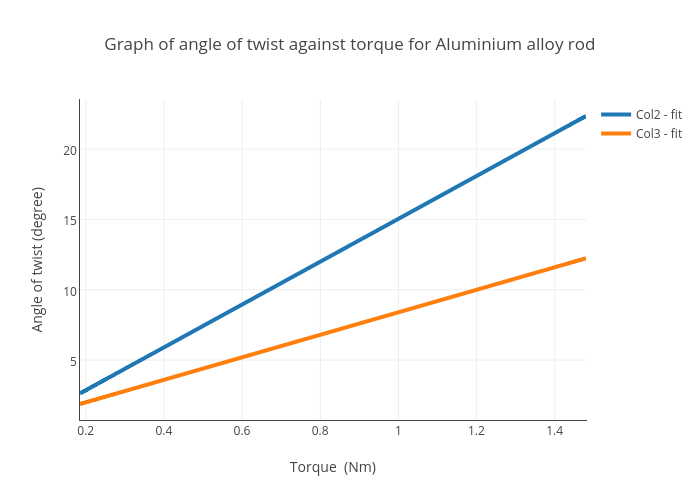
Shaadinho's interactive graph and data of "Graph of angle of twist against torque for Aluminium alloy rod " is a scatter chart, showing Col2 - fit vs Col3 - fit; with Torque (Nm) in the x-axis and Angle of twist (degree) in the y-axis.. The x-axis shows values from 0.185 to 1.48. The y-axis shows values from 0.7418190356965162 to 23.485437931695355.