Edit chart
Loading graph
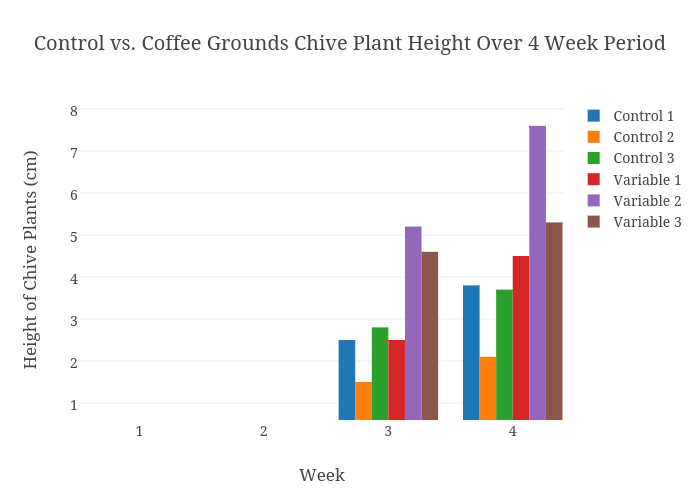
Serenalewin's interactive graph and data of "Control vs. Coffee Grounds Chive Plant Height Over 4 Week Period" is a bar chart, showing Control 1, Control 2, Control 3, Variable 1, Variable 2, Variable 3; with Week in the x-axis and Height of Chive Plants (cm) in the y-axis.. The x-axis shows values from 0.5206462459622728 to 4.412065377691228. The y-axis shows values from 0.5943034792198487 to 8.2151411682837.