Edit chart
Loading graph
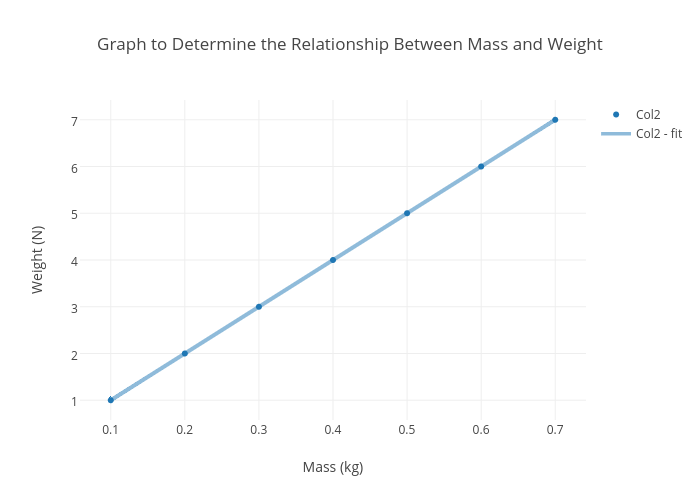
Selliott105's interactive graph and data of "Graph to Determine the Relationship Between Mass and Weight" is a scatter chart, showing Col2 vs Col2 - fit; with Mass (kg) in the x-axis and Weight (N) in the y-axis.. The x-axis shows values from 0.06037735849056604 to 0.7396226415094339. The y-axis shows values from 0.5625 to 7.4375.