Edit chart
Loading graph
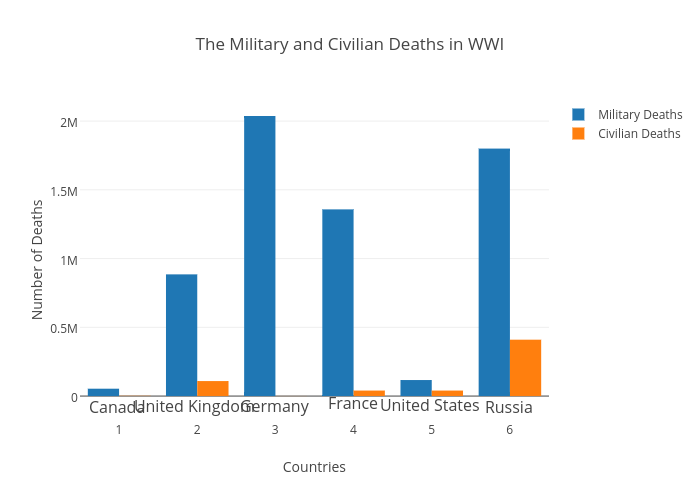
Sampang1581's interactive graph and data of "The Military and Civilian Deaths in WWI" is a bar chart, showing Military Deaths vs Civilian Deaths; with Countries in the x-axis and Number of Deaths in the y-axis.. The x-axis shows values from 0.5 to 6.5. The y-axis shows values from -147332.31156286655 to 2151964.8585033086. This visualization has the following annotations: Canada; United Kingdom; Germany; France; United States; Russia