Edit chart
Loading graph
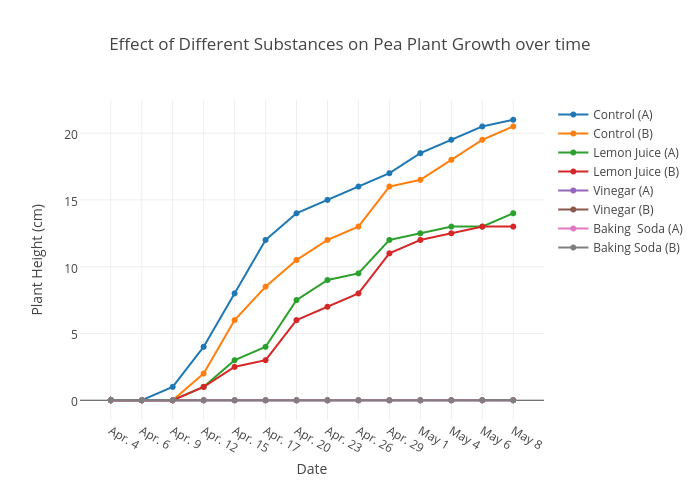
Samborton's interactive graph and data of "Effect of Different Substances on Pea Plant Growth over time" is a scatter chart, showing Control (A), Control (B), Lemon Juice (A), Lemon Juice (B), Vinegar (A), Vinegar (B), Baking Soda (A), Baking Soda (B); with Date in the x-axis and Plant Height (cm) in the y-axis.. The x-axis shows values from -0.8718280683583636 to 13.871828068358363. The y-axis shows values from -1.4736842105263157 to 22.473684210526315.