Edit chart
Loading graph
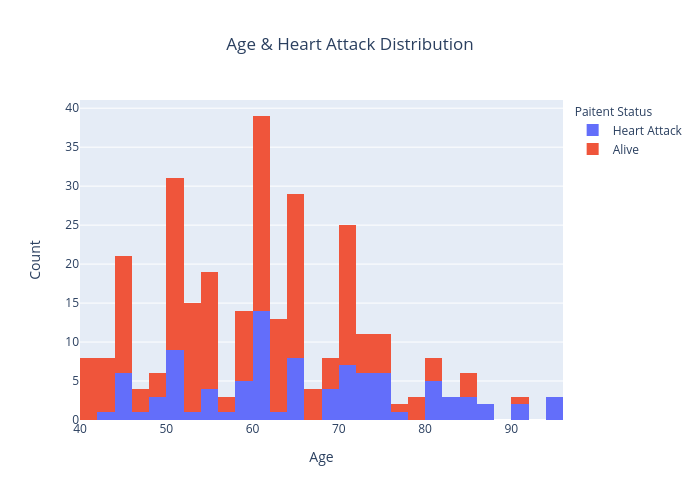
Sahilbagwe's interactive graph and data of "Age & Heart Attack Distribution" is a histogram, showing Heart Attack vs Alive; with Age in the x-axis and Count in the y-axis.. The x-axis shows values from 40 to 96. The y-axis shows values from 0 to 41.05263157894737.